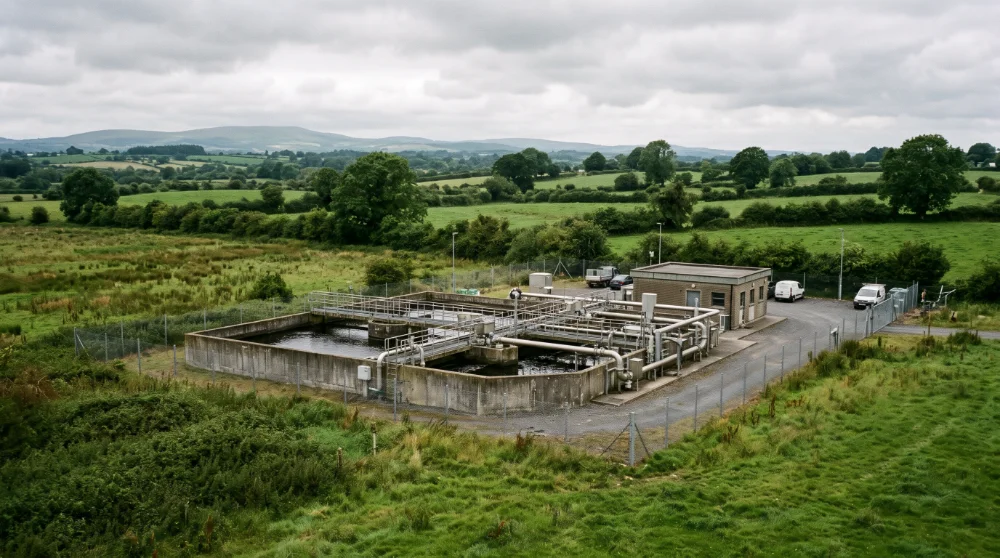
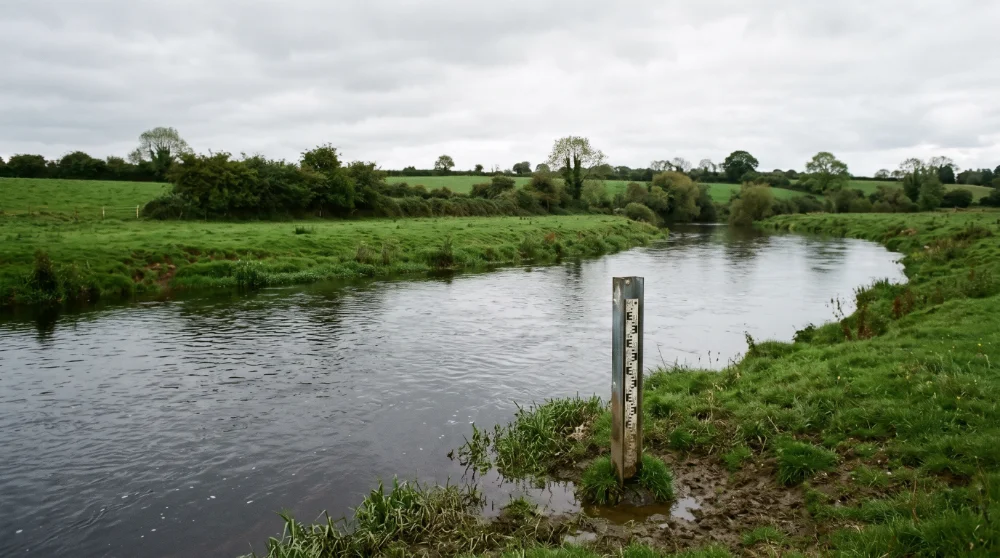
The EPA has released new figures showing that nitrogen levels in Ireland’s major rivers carried on rising in the first half of 2026. The percentage increase may be small, but it’s the second year in a row that we’ve seen an increase. If you’re into water quality, farming policy or the health of Irish estuaries, you’ll definitely want to take a closer look at this data.

What the Report Actually Says
The EPA’s Early Insights Nitrogen Indicator Report for January to June 2026 uses monitoring data from 20 sites on major rivers across the country. On average, the nitrogen levels at these sites were 4.3% higher than during the same six-month period in 2025. This is up 10% from 2024 to 2025.
The report isn’t a full yearly review. It’s an early signal, published halfway through the year, to give regulators, farming bodies and the public an idea of the direction things are moving before the full dataset is available. The EPA has been producing these six-month indicators since 2024.
The problem’s still there. There are still high levels of nitrogen in the south and south-east of the country. These are areas where farming is pretty intensive and where the soil can drain away easily, meaning nitrogen can move quickly from the land into the watercourses. The EPA’s own review says that farming is the main thing that puts nitrogen into Irish rivers, mostly from chemical fertiliser and manure.
So, why is nitrogen important for rivers and estuaries?
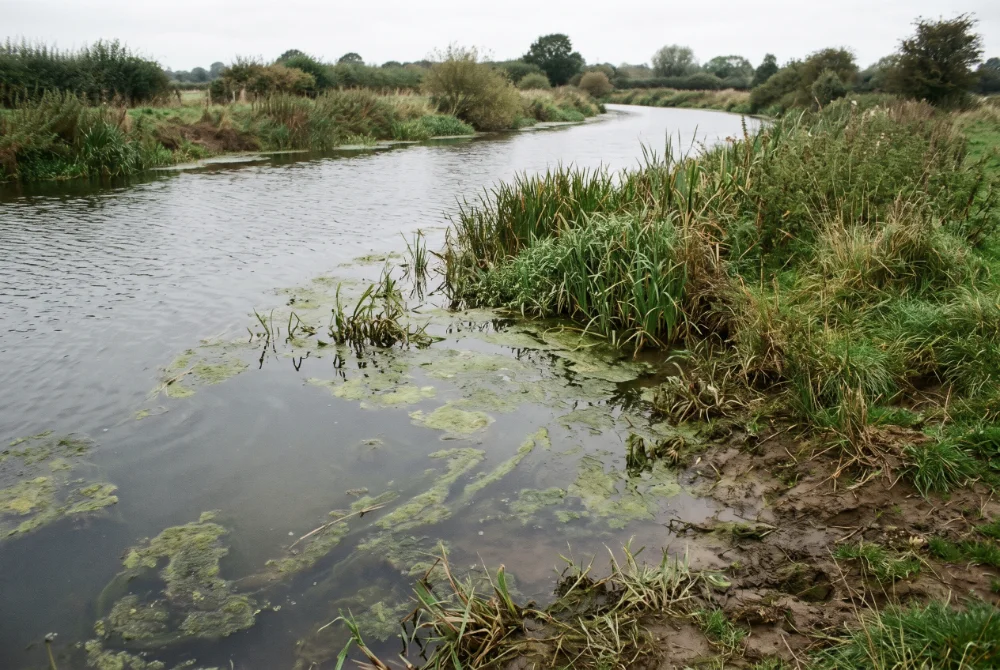
Nitrogen is a nutrient. In the right amount, it helps plants to grow. Too much of it can cause problems. If you’ve got too much nitrogen in a river, lake or estuary, it can cause an overgrowth of algae. That’s right, the algae growth is bad news for the fish and other species that live there, as it uses up the oxygen in the water.
Estuaries and coastal waters are really sensitive to nitrogen. The EPA uses a standard of 2.6 milligrams per litre of nitrogen (which is the same as 11.5 milligrams per litre of nitrate) as the threshold for ensuring the ecological health of estuaries is good. When river nitrogen levels go above this, the water downstream on the coast is put under pressure.
The report also says that high nitrate levels in drinking water can be bad for people’s health, especially young children. That’s a whole other issue from the ecological damage, but it’s part of the reason why nitrogen levels are monitored so closely.
So, what’s behind this rise, then?
The EPA says the 2026 rise isn’t down to just one thing. Nitrogen levels in rivers change because of a few different things: how much nitrogen is put on land, how that land is managed, and what the weather does. Rainfall and river flow affect how nitrogen moves from soil into water. In some areas, heavy rain can wash more nitrogen into rivers. In some cases, high flow can dilute concentrations.
There’s also a time lag built into the system. It can take months or years for nitrogen to travel through soil and groundwater before it reaches a river. So, the nitrogen measured in 2026 might partly show what farming practices were like in the years before.
The EPA report says that looking at fertiliser sales data is one way to tell how much nitrogen is being added to water. Sales of chemical fertiliser nitrogen went up by 10.6% in 2024 compared to 2023, and by a further 12.5% in 2025. The Department of Agriculture, Food and the Marine’s latest figures show a 7.3% increase in the six months to the end of March 2026 compared to the same period a year earlier. The EPA says that sales figures don’t directly equal the amount of fertiliser spread on fields or the amount lost to water. But they do show how much nitrogen is entering the agricultural system.
On the other hand, livestock numbers have been falling. The Central Statistics Office recorded a 3.3% drop in the national herd between 2023 and 2024, with a further 0.4% drop in 2025. If there are fewer animals, there should be less organic nitrogen from their manure. The fact that river nitrogen levels are still rising despite this reduction suggests that other factors, including weather patterns and the lag effect in groundwater, are playing a significant role.
The FLAG map and targeted action
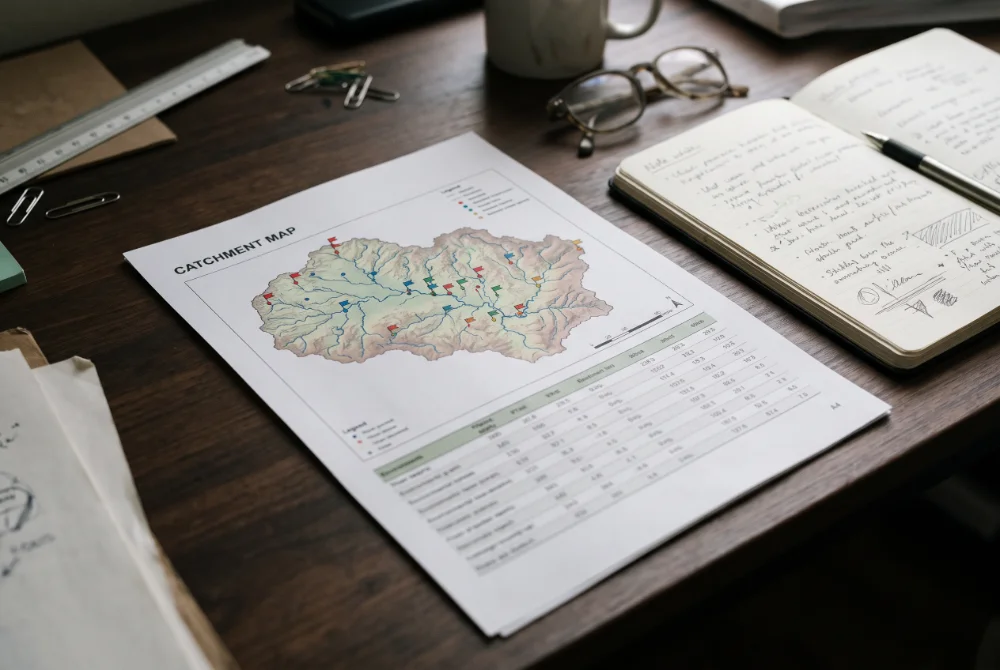
The EPA has created a tool called the Farm and Landscape Measures for Agriculture map, also known as the FLAG map. It shows where we need to make changes to reduce the loss of nitrogen from farming. The map uses flags to show different types of pressure. An orange flag shows where nitrogen is lost into water and this needs to be stopped. The EPA says the map should be used to focus on the areas most at risk, especially where farming is intensive and soils drain easily.
The map shows that it would be better to focus on the areas of the country where there is the most risk of nitrogen loss. The EPA has also published estimates of how much nitrogen needs to be reduced in each river basin to meet water quality targets. The required reductions are between 2% and 38%, depending on the area.
What did the EPA do?
Roni Hawe, who works at the EPA’s Office of Evidence and Assessment, said she was disappointed with the results. She said that in recent years more people have been trying to reduce the loss of nitrogen. Farmers, industry and other important groups have been working on this. But she said the findings show that more work is needed to turn actions on the ground into improvements in water quality. She also said that policy and practice should be more closely linked. She pointed out that improving water quality can have positive effects on agriculture, biodiversity and the climate.
The EPA’s statement does not blame any particular area for this. It says that things are being done, but it’s clear that the response is not as big as the problem.
What happens next?
The Early Insights report is a way of measuring how well the project is doing. The full yearly review for 2026 will be published later, and the next six-month report covering July to December 2026 is scheduled for March 2027. For now, the EPA says that all areas are looking again at the steps they are taking to get ready for the next Water Action Plan. The process is intended to strengthen the evidence base on what works and where measures need to be scaled up or better targeted.
At the moment, the data tells us something very clear. The amount of nitrogen in Irish rivers is not getting lower. The south and southeast are still the areas of greatest concern. The main source of nitrogen that ends up in the water is farming. And the things we’ve done so far haven’t been enough to turn things around.
Whether the next set of figures shows a change in direction will depend on what happens on farms, in catchments and in policy over the coming months. The EPA says it has the tools to take action. The question is whether the action follows.
Sources
Environmental Protection Agency. “River nitrogen levels show an increase in the first half of 2026 compared to the same period in 2025.” 16 September 2026.
Environmental Protection Agency. “Early Insights Nitrogen Indicator Report: Nitrogen concentrations in selected major rivers, January-June 2026.”
Environmental Protection Agency. “River nitrogen levels increased in 2025.” 19 March 2026.
Catchments.ie. “Early Insights Nitrogen Report 2026 Shows Increase in River Nitrogen Levels.” September 2026.
Environmental Protection Agency. “Evidence based targeting of agricultural measures to reduce nitrogen in catchments to achieve water quality objectives.”